The Evolving Human Geography of the UK
 "London" by barnyz is licensed under CC BY-NC-ND 2.0
![]()
![]()
![]()
![]()
Watch this for a quick introduction to the challenging geography of the UK!
"London" by barnyz is licensed under CC BY-NC-ND 2.0![]()
![]()
![]()
![]()
|
First you need to download the The Evolving Human Geography of the UK workbook.
Choose the best format for you: |
Top Study Tips!
Don't forget to regularly revise over the content from this topic. Your teacher will set you assignments on Seneca for this. If you can't find the assignment, check here for the Seneca Tasks. |
|
Need more help?
Have a look at the knowledge organiser for this topic to help condense your understanding. Use the PLC in the workbook to check on how well you understand what we are learning during this topic. | ||
|
Starter:
READ over the instructions for each task you are do complete for Lesson 1. This will help you to focus on the information you will need as you go through the independent research links, videos and tasks. Note: To show your work each lesson you could - 1) Complete the Word Document provided and upload completed work to ClassCharts or email to your teacher. 2) You can print off the pdf file, complete the tasks, take pictures or scan your work and upload to ClassCharts or email the work to your teacher. 3) If you are really stuck, you can simply complete the tasks on a sheet of paper and send your completed work to ClassCharts or email your teacher. |
Main task 1:
READ pages 160-161 in the Kerboodle textbook (use your same login for Kerboodle that you use for Science - the textbook for Geography has been assigned to you) Main task 2: Next, go to this website and watch the video provided. Then, in your booklet, illustrate your understanding by completing task 1. Main task 3: Now, using your knowledge from the reading on Kerboodle, answer the questions provided in task 2 in the workbook. Note - when using the doc version of the workbook you can extend the space available in the table provided so you can write more. If you are using the pdf version, you will want to also use extra lined paper when you run out of space. Main task 4: Finally, complete the map task (task 3 in the workbook). Again, if you are using the doc version, you will need to follow the instructions exactly. If you are using the pdf version, you may wish to print this page off so you can write on it. |
Plenary:
Check your understanding Complete this Google Quiz all about the Human Geography of the UK. RECORD what you achieved out of 28 points on this quiz at the bottom of the Lesson 1 workbook page. |
|
Starter:
READ pages 162-163 in the Kerboodle textbook. Main task 1: Based on your reading and on links to further information in the workbook, answer questions 1-3 in the table provided in the workbook for task 1 - these will check your comprehension of the reading task. Remember if using the doc version, that you can expand the size of the table by simply answering the questions digitally. If answering on the pdf, you may wish to use lined paper. |
Main task 2:
Now, reinforce your understanding by examining two population pyramids for the UK - London vs the Southwest. Describe their differences. Stuck? Have a look at this video to go over how to read a population pyramid. Main task 3: Now, illustrate your comprehension of the reading again, by answering questions 5 and 6 in the table in the workbook. When this is completed, research how the current government plans to invest in transport infrastructure (HS2) to reduce inequalities between regions (see the links provided in the workbook) and then answer the questions in the table. |
Plenary:
Illustrate your knowledge - Answer the exam style question in the table in the workbook: 'Explain how government policies have attempted to reduce inequalities between core and peripheral regions of the UK' (4 marks) Stuck? Have a look at the starter sentences provided in the table to support your response. |
|
Starter:
READ page 164-165 from the Kerboodle Textbook. Challenge - After reading, try writing down the key ideas from each paragraph to check your memory. |
Main task 1:
Look at the graph provided in task 1 in the workbook. Next, in the highlighted section provided above the graph, EXPLAIN what you find the most interesting/surprising/confusing thing about the graph. Challenge - can you describe what the graph shows? Main task 2: Next, CREATE a graph of the population growth of the UK using the data from figure 1 in the Kerboodle textbook - you can either use Excel, which you have access to using Microsoft 365, or other graphing software is available online for free use (eg Adobe Spark). Add in a trend line of best fit and paste your graph into the workbook. Stuck? Have a look at this video to help remind you of how to add a line of best fit on Excel. Main task 3: Use your knowledge to complete the table, illustrating your understanding from the reading in the starter. |
Plenary:
Challenge yourself - Read this article on population and immigration in the UK and summarise what you learn into one paragraph. |
|
Starter:
READ pages 166-167 in the Kerboodle Textbook Main task 1: WATCH this video about how the UK's manufacturing industry has changed. In your workbook, write the 3 most interesting numbers which tell the story of this change. |
Main task 2:
Use your knowledge from the reading to ANSWER questions 1-4 in the table provided in the workbook (remember that the table can be adapted to fit your writing if you are completing the task digitally in Word format - if you are using the pdf, please write on lined paper for more space). Main task 3: COMPLETE the diagram that has been started in the table in the workbook about the domino effect. Challenge - can you add more boxes to the diagram. to explain the process in more detail? |
Plenary:
ANSWER the exam style question: 'Explain the trends in primary and secondary employment in the UK since 1980. (4 marks) Stuck? Use the sentence starters provided in the workbook to support your answer. |
|
Starter:
READ pages 168-169 in the Kerboodle textbook. Challenge - after/during your reading, draw labelled diagrams/images for yourself to represent what you have learnt and consolidate your understanding. This will help you build this knowledge into your long term memory! Main Task 1: RESPOND to questions 1-4 in the table provided, checking your comprehension of your reading. Remember if you are completing the tasks in Word, you can adjust the size in the table for your answers. IF you are completing this using the pdf version, please use lined paper. |
Main task 2:
Next, READ back over the yellow 'understanding the new economy' box on page 169 and use it to give 3 characteristics each of the new economy in the North and South of England. Stuck? Have a look over this video to remind yourself about what the differences are between the North and the South. |
Main task 3:
ANALYSE the map in question 6 in the table provided in the workbook. Use the map to help answer this exam question: 'Explain 2 reasons why the distribution (pattern) of incomes varies across the UK' (4 marks). Stuck? Use the possible key words provided in the workbook to help support your response. Plenary: Review your learning - use this test from BBC Bitesize to check your understanding of how the UK's economy has changed in recent decades. |
|
Starter:
READ pages 170-171 in the Kerboodle Textbook Challenge - after/during your reading, draw labelled diagrams for yourself to consolidate your understanding. This will help you build this knowledge into your long term memory! Main Task 1: RESPOND to questions 1 and 2 in the table, illustrating your knowledge from the reading. Remember, if you are using the Word version of the booklet, you do have space to extend your writing - if you are working with the pdf file, you will need to write on lined paper. |
Main task 2:
RESEARCH using the links provided in question 3 in the table in the workbook about how Tata (Indian TNC) is working in the UK and India. Main task 3: Try out the Google Quiz from the start of the enquiry question again - have you made improvements on your first try? Record how you did at the bottom of page 14 in the workbook. |
Plenary:
Check your understanding - Use the Learning Checklist on the last page of the workbook to assess your understanding of the key information from Enquiry Question 1 from this topic - tick those areas of knowledge you are most confident with. Next, review the keywords from EQ1 and review/rewrite the definitions for any of the terms in the box that you are less confident in using. |
|
Starter: Download the format for the second workbook that will work best for you:
|
Starter:
Read pages 172-175 in the Kerboodle textbook or have a look here from BBC Bitesize to learn about London's location. Make a list of all the facts you know about London, think about why it is considered an important place. Challenge - List and define three key terms linked to migration. Main task 1: Using the information from your reading and the Bitesize page, complete the questions under task 1 in your workbook. Main task 2: List 3 ways London is connected nationally and regionally. Then, in your workbook, list 4 ways London is connected internationally. |
Task 3:
Using your knowledge of London's structure, label the Hoyt model provided in your workbook with details on the characteristics of different locations in London. Plenary: Tweet it or Instagram it! CREATE a 30 word tweet or a quick picture to SUMMARISE what you have learnt today! | ||
|
Starter:
READ pages 176-177 in the Kerboodle textbook. If you can't access the Kerboodle text, please use this link from BBC Bitesize. Challenge: Create your own labelled diagram to illustrate what you have learnt from your reading. |
Main task 1:
Sort the factors in your workbook under task 1 into Push or Pull factors leading people to migrate. Main task 2: Read the introduction about London and migration in your workbook and highlight 3 facts to show London's characteristics. Main task 3: Read the extract provided in your workbook and answer the comprehension questions that follow after. Challenge - research another article that highlights London's relationship to migration. Summarise in 100 words or less what the article tells you about London and migration. |
Plenary:
3, 2, 1 - Lift-off! Give me 3 key terms you needed to use in today's lesson. Give me 2 facts you didn't know about before. Give me 1 sentence to summarise today's lesson. |
|
Starter:
READ pages 178-179 in the Kerboodle textbook. Write a paragraph to summarise from your reading why you think there is inequality in London. Challenge - Do you think the inequality in London has improved or worsened over time? What do you think will happen with inequality in the capital city in the future? |
Main task 1:
Look at the cartoon in the workbook. Explain what you think the cartoon is saying about inequality in London. Main task 2: Study the pie charts in the workbook and bullet point the 3 main changes from 1960 to 2010 illustrated in the charts. Stuck? Look carefully at the key and the % provided to describe the changes. Main task 3: Watch this video and then write down 6 bullet points of information you gained from watching the video. |
Main task 4:
Using the Kerboodle pages 178-179 answer question 1, 2, and 3 on page 179. Challenge - Explain how deprivation can affect life expectancy. Next, read the article about deprived areas being affected by the pandemic and highlight 3 key points made by the article that prove that deprivation has an impact on health and wellbeing. Task 5: Answer the exam style question - Assess the causes of differences in life expectancy shown in figure 1 (8 marks). Plenary: Can you create an A4 help sheet to SUMMARISE the key take away knowledge from today's lesson? Please submit your example to your teacher. We will take the best examples and turn them into pdfs and use in department. Stuck? You could make it look like a cool infographic like this one! |
|
Starter:
LOOK back over the map of London on page 178 of the Kerboodle book. Consider the location of Newham and Richmond. |
Main task 1:
Write a description of the locations of Newham and Richmond in London. Main task 2: Complete the final column of the table by writing which borough is more deprived for each indicator provided. Then, answer the three questions underneath the table. Main task 3: Type Newham and then Richmond into a google news search. What is the overall impression given of these areas based on the news stories written about them? Main task 4: Use the graph provided in the workbook to complete the gap fill below the graph. |
Main task 5:
Use the next pie chart to describe the ethnic mix of Richmond. Main task 6: Next, answer questions 1-3 about Newham. Plenary: Look at the information about property prices and rent in each borough. Answer the following questions to finish. |
|
Starter:
READ pages 180-181. |
Main task 1:
Based on the definition of urban decline in your workbook, give 5 examples of what you might see in an area that has experienced decline. Main task 2: Place the bullet point statements provided in the workbook in order (the first one has been done for you in the workbook). Main task 3: List additional social, economic and environmental problems caused by deprivation. Challenge - explain in a short paragraph the impact that unemployment has on the area and the services. |
Task 4:
Sort the problems faced by cities after a period of decline (bullet point list) into social, economic and environmental. Challenge - Which category do you think has suffered teh most severe impacts and why? Task 5: Review your reading from pages 180-181 and use your understanding to answer questions 1-3 under task 5 in the workbook. Task 6: Complete the exam style question - Explain why many UK cities are experiencing more growth at their edges than in their centres (4 marks). Plenary: Create three true or false questions based on today's lesson for your classmates to answer. |
|
Starter:
READ pages 182-183 in the Kerboodle textbook. |
Main task:
Summarise the processes you have learnt about into the table provided in the workbook. Challenge - Following the coronavirus crisis, where do you think that people will be more willing to live and why? Would they prefer urban areas where density is high, but you can walk/cycle to work or would they prefer the suburbs or rural areas? |
Plenary:
Get creative! Can you create a simple poem or song lyrics to memorise the processes explored in today's lesson? Send in your best examples to your teacher who will share your work on our Wow Wall! |
|
Starter:
READ pages 188-189 in the Kerboodle textbook. |
Main task 1:
Rank London's six major problems (1 most serious 6 least serious) from the boxes provided. Main task 2: Justify your rankings and suggest which issues are directly linked to one another. Main task 3: Explore the problems and their solutions using page 189 in the Kerboodle textbook. Rank the solutions in order 1-6 for how effective you think they are at addressing the main problems identified in task 1. For example, if you think waste is being addressed the best, then you would rank it as number 1. Next, justify your rankings from the last task. |
Plenary:
Answer the exam style question - Evaluate the success of strategies aimed at making urban living more sustainable. (8 marks) |
|
Main task:
Using your own research and the information gathered in the starter task, list in the table provided in the workbook the economic, social and environmental costs and benefits of Terling (or any other named location) being so close to London. Main task 2: Answer the comprehension questions that follow the table. Main task 3: Explain why the rural-urban fringe is often a difficult place to live for low-wage earners or the elderly. Remember to think about not only what it is like in the rural-urban fringe (what might be missing here as well) but also what life is like for those two groups of people. Main task 4: Read pages 194-197 from the Kerboodle textbook and then list and briefly describe the 4 major problems facing Cornwall today. Main task 5: Explain why the decline of Cornwall's primary industries has made its economic problems worse. Main task 6: Explain why rural areas often have poorer services (school, doctor, buses) than urban. |
Plenary:
Complete the table in your workbook to show the benefits and costs of the Eden Project, Lobb's Farm Shop, and tourist accommodation in Cornwall to overcome their current problems. |
|
Starter:
Make sure you have reviewed the entire topic using Seneca Learning and that you have checked your understanding against the PLC (in both workbooks) before you attempt the assessment.
|
Main task 1:
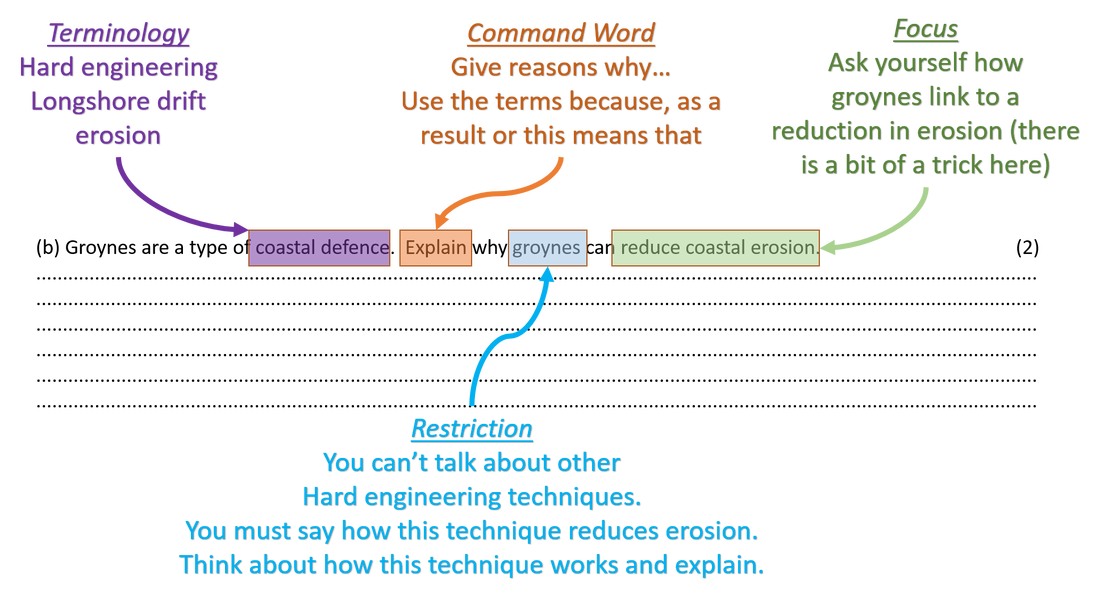
READ through all of the questions first, ensuring you are using the CRaFT technique to annotate on each question before you attempt a response. See an example of CRaFT below: |
Plenary:
COMPLETE the assessment and send to your teacher once finished. When your teacher provides you with feedback, ACTION the task provided from the feedback sheet. | ||