The Water Cycle and Water Insecurity
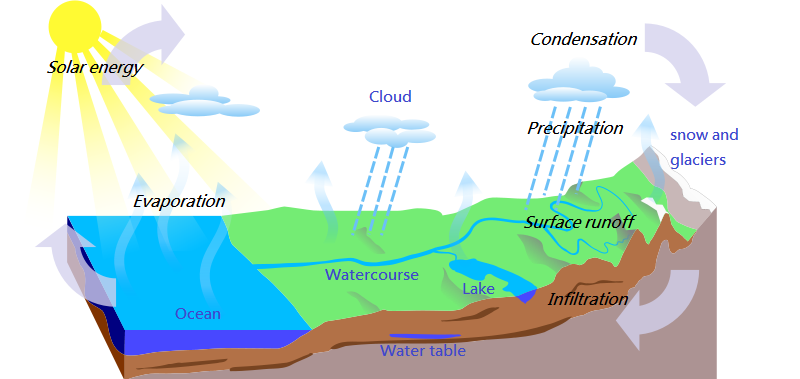
Watch this for a quick introduction to the global hydrological cycle!
|
First you need to download the Key Enquiry Question 1 Workbook
Choose the best format for you:
|
Top Study Tips!
Don't forget to regularly revise over the content from this key enquiry question. Mrs Mitchell will set you assignments on Seneca for this. If you can't find the assignment, check here for the Seneca Tasks. Use the following link to review content from KEQ1 at the end: https://www.pearsonactivelearn.com/ebook.asp?id=OTg2OTkxfGJvb2t8MTUwfDA= | ||||
|
|
|
|
|
Starter:
READ over the instructions for each task you are do complete for Lesson 1. This will help you to focus on the information you will need as you go through the independent research links, videos and tasks. Note: To show your work each lesson you could - 1) Complete the Word Document provided and upload completed work to Show My Homework or email to Mrs Mitchell. 2) You can print off the pdf file, complete the tasks, take pictures or scan your work and upload to Show My Homework or email the work to Mrs Mitchell. 3) If you are really stuck, you can simply complete the tasks on a sheet of paper and send your completed work to Show My Homework or email to Mrs Mitchell. |
Main task 1:
READ pages 24-25 in the textbook (link provided in the workbook). Main task 2: DEFINE the following terms: Stores Fluxes Processes Main task 3: In the space provided in your workbook, DRAW the global hydrological cycle, including the key stores (including %s), fluxes (including amounts), and processes. Main task 4: MATCH the key terms linked to main stores of water to their definitions in the workbook. |
Plenary:
Using your knowledge and the information on the second page of your workbook, EXPLAIN why only such a small percentage of freshwater is accessible for human use. Need some help? Have a look at this video from TEDEd for some further guidance. |
|
|
|
|
Starter:
READ pages 26-30 from the textbook (link to Active Learn provided in the workbook). Main task 1: WATCH the first video on drainage basins and use it to define the following key terms: Drainage basin Watershed Catchment |
Main task 2:
In the space provided in the workbook, DRAW the drainage basin cycle. You must label and colour code all the aspects into stores, inputs, outputs and flows. Make sure you include a key. MAIN task 3: READ about the ITCZ in the workbook - this is important as it will remind you about what factors influence the differences between drainage basins. HIGHLIGHT the key details in the workbook and annotate with your thoughts. Stuck? Have a look at this video from the MetOffice as a reminder of how the Earth's climate system functions. |
Main task 4:
In your workbook, using your knowledge and the second video, FILL in the table to SUMMARISE how the drainage basin system works include the details on inputs, fluxes, flows and transfers, and outputs. Plenary: Using your knowledge, EXPLAIN how through flow and groundwater flow are different. |
|
|
|
|
Starter:
READ pages 30-32 in the textbook (link provided to Active Learn in the workbook). |
Main task 1:
WATCH the first video and use your knowledge from the reading to fill in the table in the workbook to SUMMARISE how named physical factors influence drainage basins. Main task 2: Using your knowledge, EXPLAIN how physical factors have led to contrasts in the hydrological cycles shown in figures 1.9a and 1.9b in the workbook. Main task 3: WATCH the second video and using it, along with your knowledge from your reading, FILL in the table in the workbook with detail on human influences including TYPE, DESCRIPTION, what it AFFECTS (input/processes/outputs), NAMED EXAMPLE with place based detail, and JUDGEMENT of severity of impact. |
Plenary:
SUGGEST what the effects of afforestation would be on drainage basin flows. |
|
|
|
|
|
Starter:
READ pages 33-37 in the textbook (link provided to Active Learn in the workbook). Main task 1: WATCH the first video and use your knowledge from the reading to define the key terms below: Water budgets River regimes Storm hydrographs |
Main task 2:
Using your knowledge, COMPLETE the formula in the workbook and annotate off what each symbol means. Then IDENTIFY who the formula would be useful for and EXPLAIN why these groups of people would find the formula useful. Main task 3: LOOK at Figure 1.12 in the workbook. ANNOTATE around the diagram what you notice about the global water budgets. Need help? Match the budget up to the map of the world below and see where is in surplus and where is in deficit. 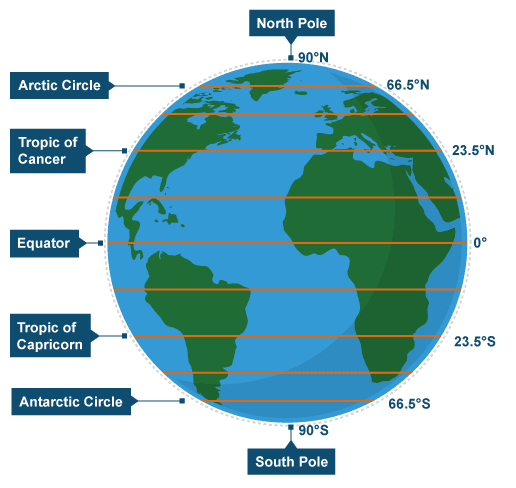
|
Main task 4:
WATCH the second video provided and use it, along with your knowledge from the reading, to complete the missing detail from the soil moisture budget graph in the workbook. Then IDENTIFY who the soil moisture budget graph would be useful for and EXPLAIN why these groups of people would find the graph useful. Main task 5: Using your knowledge from reading, create a mind map in the workbook to IDENTIFY what factors can affect river regimes. Main task 6: Using the third video and your knowledge from reading, FILL in the blanks with definitions for features of a storm hydrograph in your workbook. Plenary: To finish, FILL in the missing details to illustrate your knowledge of the differences between flashy and subdued hydrographs. |
|
Starter:
READ page 32 in the textbook (link provided to Active Learn in the workbook). Main Task 1: WATCH the video and use your knowledge from the reading to ANNOTATE around each of the images in Figure 1.17 in the workbook how aspects from the diagrams lead to an impact on the hydrological cycle. |
Main task 2:
EXPLAIN what influence decision makers and planners have to manage a catchment area as a whole. Stuck? Check out this extract from the Hodder Book to support your understanding. Main task 3: EXPLAIN how urbanisation increases runoff and the risk of flooding. Need help? Start by thinking about what tarmac does to rates of infiltration. |
Main task 4:
Complete the Key Enquiry Question 1 Quiz. Send your completed quiz to Mrs Mitchell for grading. Complete the plenary task below when Mrs Mitchell has sent back your feedback. Plenary: Complete the feedback tasks provided by Mrs Mitchell to improve one of the questions from your KEQ 1 quiz. Do this in a different colour pen from the one you used to answer the quiz. |
|
Starter:
READ pages 40-45 in the textbook (link provided to Active Learn in the workbook). Main Task 1: DEFINE the term drought and IDENTIFY the different types of drought that exist - you will then CLASSIFY these into physical and human caused. |
Main task 2:
In the workbook, MATCH up the definitions of each type of drought with their correct terms. Then HIGHLIGHT what are the causes and what are the impacts on the hydrological cycle in two different colours. Main task 3: LOOK at the map near the bottom of the page illustrating those locations around the world that are at risk of drought. Can you first DESCRIBE where in the world is more at risk from drought and then EXPLAIN, using meteorological reasons, why this may be? (look at Figure 1.15 in the book to help). Main task 4: WATCH the second video (linked at the top of the start of Lesson 6) and READ the details in the workbook on ENSO. In your workbook, DESCRIBE what this process is in your own words. Next, DRAW two diagrams to illustrate how ENSO works (El Niño and La Niña need to be drawn) Make sure you add in your key LABELS. |
Plenary:
Finally, RESEARCH the impacts of recent droughts caused by El Niño and La Niña events RECORD in your workbook what you find out. Take it further - Ever wondered why areas that have suffered from drought can sometimes experience flash flooding? Have a look at the last video for today's lesson to find out. |
|
Starter:
READ pages 46-48 in the textbook (link provided in your workbook). |
Main task 1:
CATEGORISE in your workbook all the ways that humans directly and indirectly affect drought. Stuck? Have a look near the bottom of the article linked here. Main task 2: USE the case study inset on pages 46-47 in the textbook and the first video above to CREATE a fact file on drought in the Sahel. You must include details on underlying factors, physical causes, human causes and impacts. Challenge - can you explore current responses to the drought in the Sahel? Main task 3: RESPOND to the question in your workbook - To what extent have the Sahel Drought years since 1970 been due to human actions? |
Main task 4:
USE the case study inset on page 48, the second and third videos above and further research to CREATE a fact file about drought in Australia. You need to again provide detail on underlying factors, physical causes, human causes, and impacts. Challenge - can you explore current responses to drought in Australia? Plenary: Pull it together - Based on your learning today, what influence do you believe levels of development have on drought risk and resilience? Take if further - What can NGOs do to educate people about drought? Have a look at ActionAid's explanation of the causes and impacts of drought here. |
|
|
|
|
Starter:
READ pages 49-50 in the textbook (link provided to Active Learn in the workbook provided). |
Main task 1:
DEFINE the following key terms - Ecosystem functioning and Ecosystem resilience. Main task 2: In the dashed box on the workbook, EXPLAIN what is a wetland. Hint - check the second paragraph on page 49 or look here. Next, look at the diagram of a working, healthy wetland in the workbook. Consider what you have learnt about the effects of drought on a wetland ecosystem. ADAPT the diagram and add ANNOTATIONS to help EXPLAIN at least 5 specific ways in which wetlands are affected by drought. Main task 3: WATCH the first video above. It is hilarious so you can very much laugh along with the TED audience! After you have watched, WRITE down in the dashed box on the workbook what you have learnt about the value of wetland ecosystems for biodiversity. |
Main task 4:
READ about how forest ecosystems are affected by drought on page 50. Then WATCH the second video. Now ADAPT the diagram of a healthy forest ecosystem in the workbook and add ANNOTATIONS to help EXPLAIN at least 5 ways in which forest ecosystems are affected by drought. Plenary: In the workbook, answer the following question - Using named examples, SUGGEST two impacts of drought on ecosystem functioning. (6 marks) |
|
Starter:
READ pages 51-54 in the textbook (link provided to the Active Learn pages in the workbook). |
Main task 1:
Based on your reading, ANSWER the following in the workbook - Why does flooding happen? Main task 2: Using the map provided in the workbook, DESCRIBE the locations around the world that are most at risk from flooding. Challenge - can you link your descriptions back to the tricellular model? Main task 3: Using your knowledge from the reading and the first 5 videos provided for this lesson, in the table in the workbook, SUMMARISE the 4 key flood producing (physical) conditions that exist. |
Main task 4:
LOOK at figure 1.27 in the workbook. Using your knowledge of human causes of flooding from your reading and the last video provided above, ANNOTATE around the figure how human actions (at least 5) can lead to more flooding. Hint - you will want to link back to the knowledge you gained in KEQ1 as well! Plenary: Pull it together - Using the table in the workbook, your reading of pages 53-54 and further research, you are going to APPLY your learning to the floods in the UK in 2015-2016. Take it further - can you create a comparative case study by exploring the 2012 flood events in the UK. How were these events similar/different from the 2015-2016 floods? |
|
|
|
|
Starter:
READ pages 55-57 in the textbook (link provided in the workbook). |
Main task 1:
Based on what you have read and the first two videos above, DESCRIBE the possible changes that could happen to the hydrological cycle due to climate change (at least 3 changes are needed with specific details on the processes/flows that will be changed). Main task 2: LOOK at figure 1.30 in the workbook and COLOUR CODE the impact boxes into social, economic and environmental impacts. Then ANNOTATE off at least 5 of the impacts for the knock-on effects that haven't been noted in the figure, which you are aware of from your reading, watching the third video and your wider knowledge. Main task 3: WATCH the last video above. Then LOOK at figure 1.31 in the workbook. DESCRIBE the main features of the future drought risk pattern. Which countries with large or dense populations will be affected most. ANNOTATE your ideas around the map. Main task 4: LOOK at figure 1.32 in the workbook. DESCRIBE the future pattern of flood frequency in the world by making ANNOTATIONS around the map. SUGGEST which countries or parts of the world affected the most may have a lower ability to adapt to this change. |
Main task 5:
Using your knowledge from KEQ2, EXPLAIN in the dashed box in the booklet why the future is uncertain for water security. Main task 6: Complete the Key Enquiry Question 2 Quiz. Send your completed quiz to Mrs Mitchell for grading. Complete the plenary task below when Mrs Mitchell has sent back your feedback. Plenary: Complete the feedback tasks provided by Mrs Mitchell to improve one of the questions from your KEQ 2 quiz. Do this in a different colour pen from the one you used to answer the quiz. |
|
Starter:
Download the workbook below that works best for your needs. |
Main task 1:
READ pages 58-59 in the textbook (link to Active Learn provided in the workbook). Main task 2: DEFINE the following key terms - Water insecurity Renewable water resources Main task 3: In the workbook, MATCH up the definitions of key terms linked to water availability with their correct terms. HIGHLIGHT from the text provided key number facts that differentiate each term from one another. |
Plenary:
WATCH the video above. Use your this, along with your knowledge from the reading, to ANNOTATE around the Venn diagram provided in the workbook about the main drivers of water scarcity (two have been done for you). |
|
Starter:
READ pages 59-61 in the textbook (link for these pages in the workbook). |
Main task 1:
Using your knowledge from the reading and the two videos on climate change provided, FILL in the table in the workbook to help explain physical causes of water scarcity. Main task 2: Using your knowledge from the reading and the rest of the videos provided, FILL in the table in the workbook to help explain the human causes of water scarcity. |
Plenary:
In the workbook, DEFINE what safe water is in the dashed box and then EXPLAIN what this term has to do with the content explored in today's lesson. |
|
Starter:
READ pages 62-64 in the textbook (see the link to Active Learn in the workbook). |
Main task 1:
DEFINE the following key terms - Physical water scarcity Economic water scarcity Main task 2: LOOK at figure 1.34 in the workbook. Based on your knowledge from the reading and the first video, ANNOTATE around the graph to explain why there is an increasing demand for water. Main task 3: LOOK at the map in the workbook. SUGGEST in the dashed box below why the pattern of physical and economic scarcity exists as it does today. Hint - WATCH the second and third videos to support your suggestions. |
Main task 4:
READ about the water poverty index in the workbook and on page 64. ADD the data from the countries provided in Table 1.9 onto the graph provided in the workbook. Main task 5: DESCRIBE the variations in WPI in the table provided for countries at different levels of development and SUGGEST reasons for the variations you have noticed. Plenary: Push your understanding further - Can you pull all of your learning today together and EXPLAIN why the price of water varies spatially? |
|
Starter:
READ pages 64-65 in the textbook (link provided to Active Learn in the workbook). |
Main task 1:
Using the STEEP grid provided in the workbook, your reading, the video above and further research, you will ANALYSE how water is key for development. Use the question prompts at the start of the grid to help fill the grid in with key information. |
Plenary:
In the dashed box in the workbook, EXPLAIN why rising standards of living leads to an increase in per capita water consumption. |
|
|
|
|
Starter:
READ pages 65-67 in the textbook (link provided to Active Learn in the workbook). |
Main task 1:
DEFINE the following key term - Transboundary water Main task 2: Based on what you have READ, the two videos above and further research (start by using the link in the workbook), you are to FILL in the contrasting case study table for how management of two different river systems is leading to conflict between stakeholders. Main task 4: EXPLAIN how conflicts over water management can arise. |
Main task 5:
Using your rading, wider knowledge and further research, FILL in the table to ANALYSE the roles and attitudes of different groups of people at different scales when it comes to managing the River Nile. Plenary: Take if further - Can you create your own table to ANALYSE the roles and attitudes of different groups of people along the Mekong River? |
|
Starter:
READ pages 67-69 in the textbook (link for the pages can be found in your workbook). |
Main task 1:
DEFINE the following key terms - Water transfer schemes Mega dams Desalination Main task 2: Based on what you have read, the three videos above and further research, you are to FILL in the contrasting case study table below for different hard engineering schemes (you will need detail on all three examples to illustrate range in the exam). |
Plenary:
ANSWER the following in your workbook - Why is desalination a limited option for increasing global water supplies? |
|
|
|
|
Starter:
READ pages 69-71 in the textbook (link provided to Active Learn in the workbook). |
Main task 1:
DEFINE the following key term - Sustainable water management Main task 2: Based on what you have READ, the four videos above and further research, you are to FILL IN the contrasting case study table below for different sustainable water management schemes (you need detail on all 4 to illustrate range in the exam). |
Plenary:
In your workbook, EXPLAIN the advantages and disadvantages of a sustainable water management scheme. |
|
|
|
|
|
Starter:
READ pages 71-72 in the textbook (link to Active Learn is in your workbook). |
Main task 1:
WATCH the first video on IDBM. DEFINE the key terms below - Integrated Drainage Basin Management Water Sharing Treaties Main task 2: Based on what you have read and using the Colorado River and Chasing Rivers videos above, ANNOTATE around the map of the Colorado River Basin in your workbook details of the catchment area, problems with water sharing in the basin, agreements and issues that have arisen since 1990. Challenge - can you also ANNOTATE details for what has been done to solve some of the issues you've noted (the last few minutes of Chasing Rivers will help you with this). Main task 3: STUDY the Berlin Rules (see page 72 in the textbook or here). In your workbook, ANSWER the following question - Why do you think these rules have not been implemented? |
Main task 4:
WATCH the fourth video (Water and Governance). Based on what you have learnt, EXPLAIN why there are still issues with water and governance. Plenary: WATCH the final video above (Water Wars). EVALUATE the factors increasing the likelihood of water wars (eg. which ones do you think pose the most significant risk? Do you think water wars are likely overall?). This will help you to draw together everything you have learnt over this last key enquiry question. |
|
Starter:
Make sure you have REVIEWED the entire topic using Seneca Learning and that you have checked your understanding against the PLC (at the top of the page) before you attempt the assessment.
|
Main task 1:
READ through all of the questions first, ensuring you are using the CRaFT technique to annotate on each question before you attempt a response. |
Plenary:
COMPLETE the assessment and send to your teacher once finished. When your teacher provides you with feedback, ACTION the task provided from the feedback sheet. | ||
